
Le Leader
Performance des Applications et monitoring experience digitale
Notre mission
« Accompagner les équipes DSI ou les Directions Digitales avec nos Experts sur tout le cycle Dev to Ops des applications, afin de garantir les Performances des SI jusqu’au Monitoring de la satisfaction des utilisateurs »
NOS CLIENTS FONT CONFIANCE
A NOTRE CENTRE INGENIERIE & EXPERTISES PERFORMANCES


CENTRE D'INGÉNIERIE & EXPERTISES PERFORMANCES
UNE ÉQUIPE AVEC +25 ANS D'EXPÉRIENCE AU SERVICE DE NOS CLIENTS

Vous recherchez des ressources tests de charge et APM
Assitance Technique Performance
Notre équipe d’assistance technique est constituée de Consultant ou d’Ingénieurs Tests de Charge ou APM, certifiés sur les outils du marché tels que NeoLoad, Loadrunner, Dynatrace, Appdynamics ou sur Jmeter.
Toutes nos ressources possèdent plusieurs années d’expérience dans les domaines des tests de charge ou du monitoring de performance application et la mise en œuvre ou l’exploitation de ces outils.
- Notre Centre Ingénierie & Expertises Performances pour vos besoins urgents
CENTRE INGENIERIE ET EXPERTISES PERFORMANCES & SOLUTIONS MODE SERVICES MANAGÉS
Tests de Performances à La Demande et Forfaitaires

Un projet de tests de performances ponctuel ou plusieurs projets en parallèle sur l’année sans avoir à gérer les contraintes en ressources spécialisées liées aux pics des demandes de projets ou des problèmes de disponibilité des logiciels de performances ou le provisioning des infrastructures techniques.
Le CIEP (Centre d’Ingénierie et Expertises Performances) vous apporte de la réactivité, de la flexibilité pour aligner les ressources et les moyens techniques en fonction de vos besoins et de vos contraintes.
Nos logiciels POWERHOUSE NUDGE, nos moyens techniques (Cloud Infrastructures Performances) et notre organisation permettent de proposer notre modèle innovant « STOP and GO » pour plus d’efficacité et pour optimiser vos dépenses.

EN MODE SERVICEs MANAGÉS AVEC ENGAGEMENT DE SLA DE LA MCO
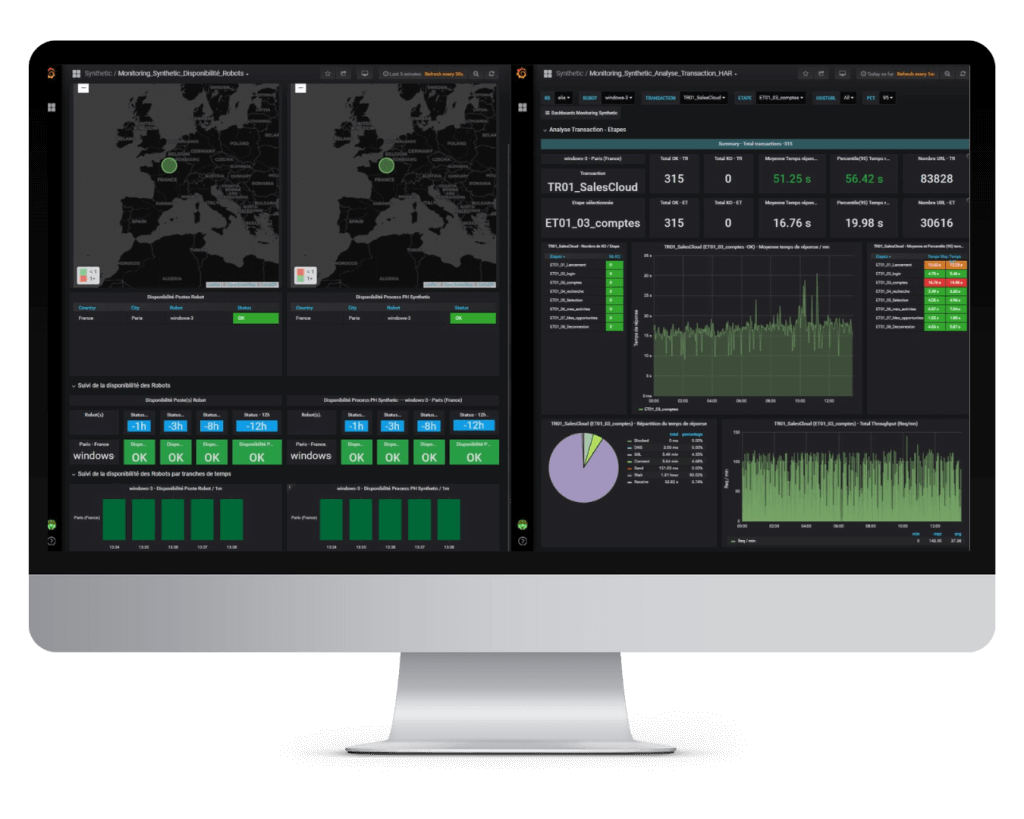
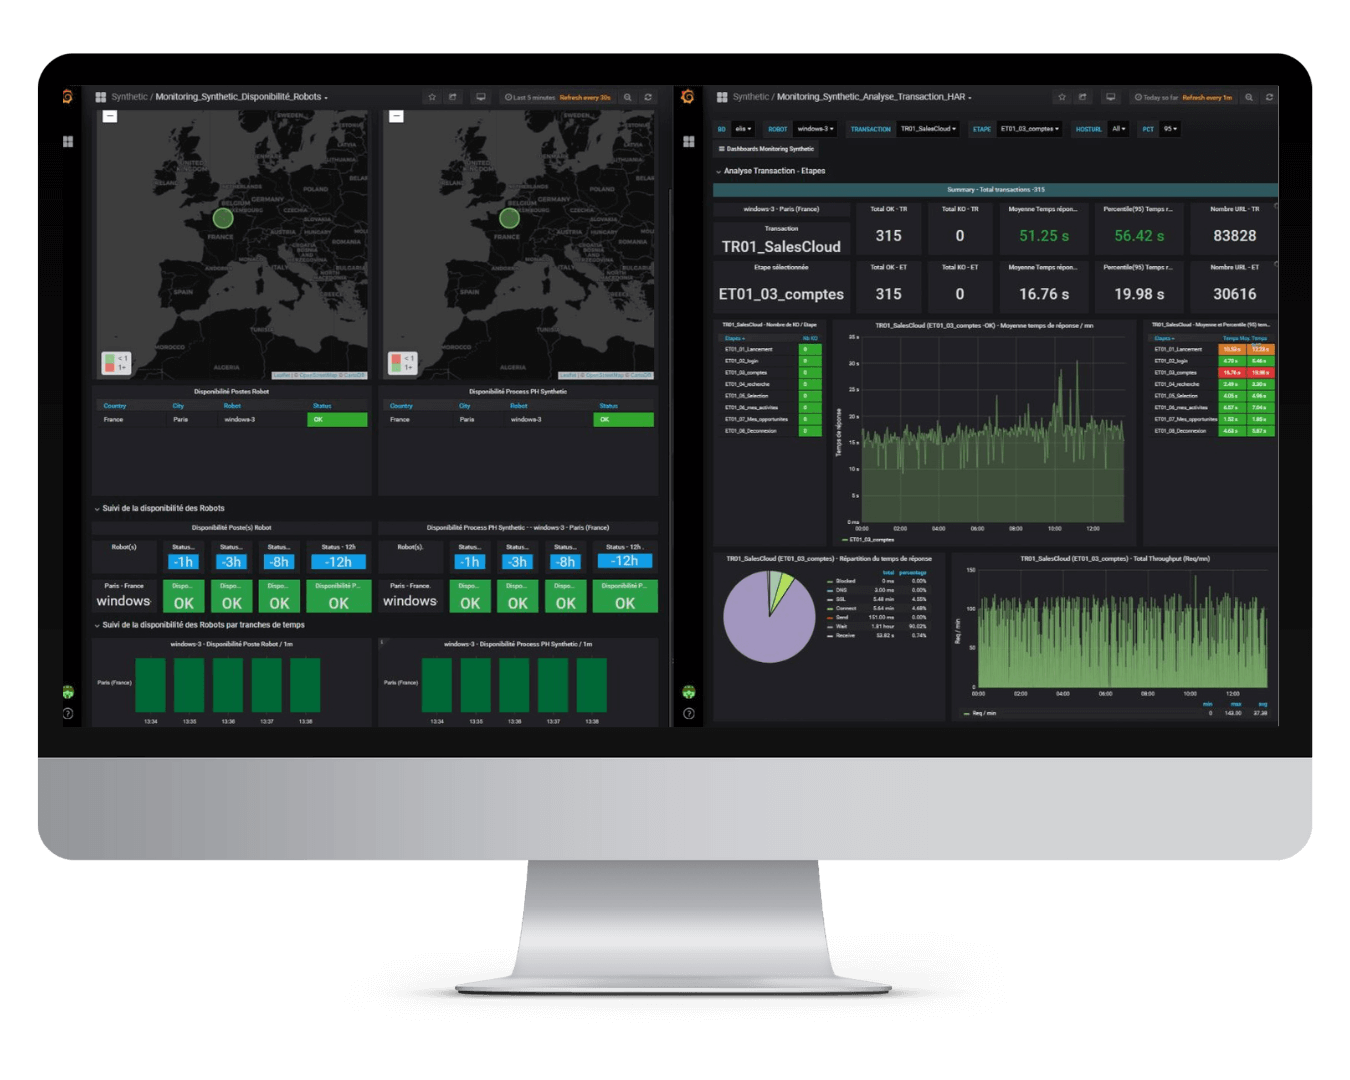
Monitoring Disponibilité et Expérience Digitale Utilisateurs
Le Monitoring Disponibilité et Expérience Digitale Utilisateur est très souvent difficile et chronophage à gérer par les équipes internes de la DSI. Et souvent, sources de tension entre la DSI et ses “Clients Internes”. Les problèmes recensés sont : des ressources non dédiées à 100%, le Turn Over, le manque de réactivité et de flexibilité face aux modifications ou évolutions des applications. Ces problèmes impactent fortement la maintenance en condition opérationnelle (MCO) donc la qualité du service rendu aux Métiers ou aux Directions Digitales.
Le CIEP ATAKAMA est organisé pour assurer le déploiement et la MCO du Monitoring Disponibilité et Qualité Expérience Digitale des Utilisateurs. Le CIEP ATAKAMA propose des engagements de SLA sur la MCO et les évolutions de la solution déployée. Vous n’avez plus les problèmes de gestion de la solution et vos “Clients Internes” reçoivent quotidiennement les rapports conçus spécifiquement pour répondre à leur besoin.
EN MODE SERVICEs MANAGÉS AVEC ENGAGEMENT DE SLA DE LA MCO
Monitoring de Performance des Applications (APM )
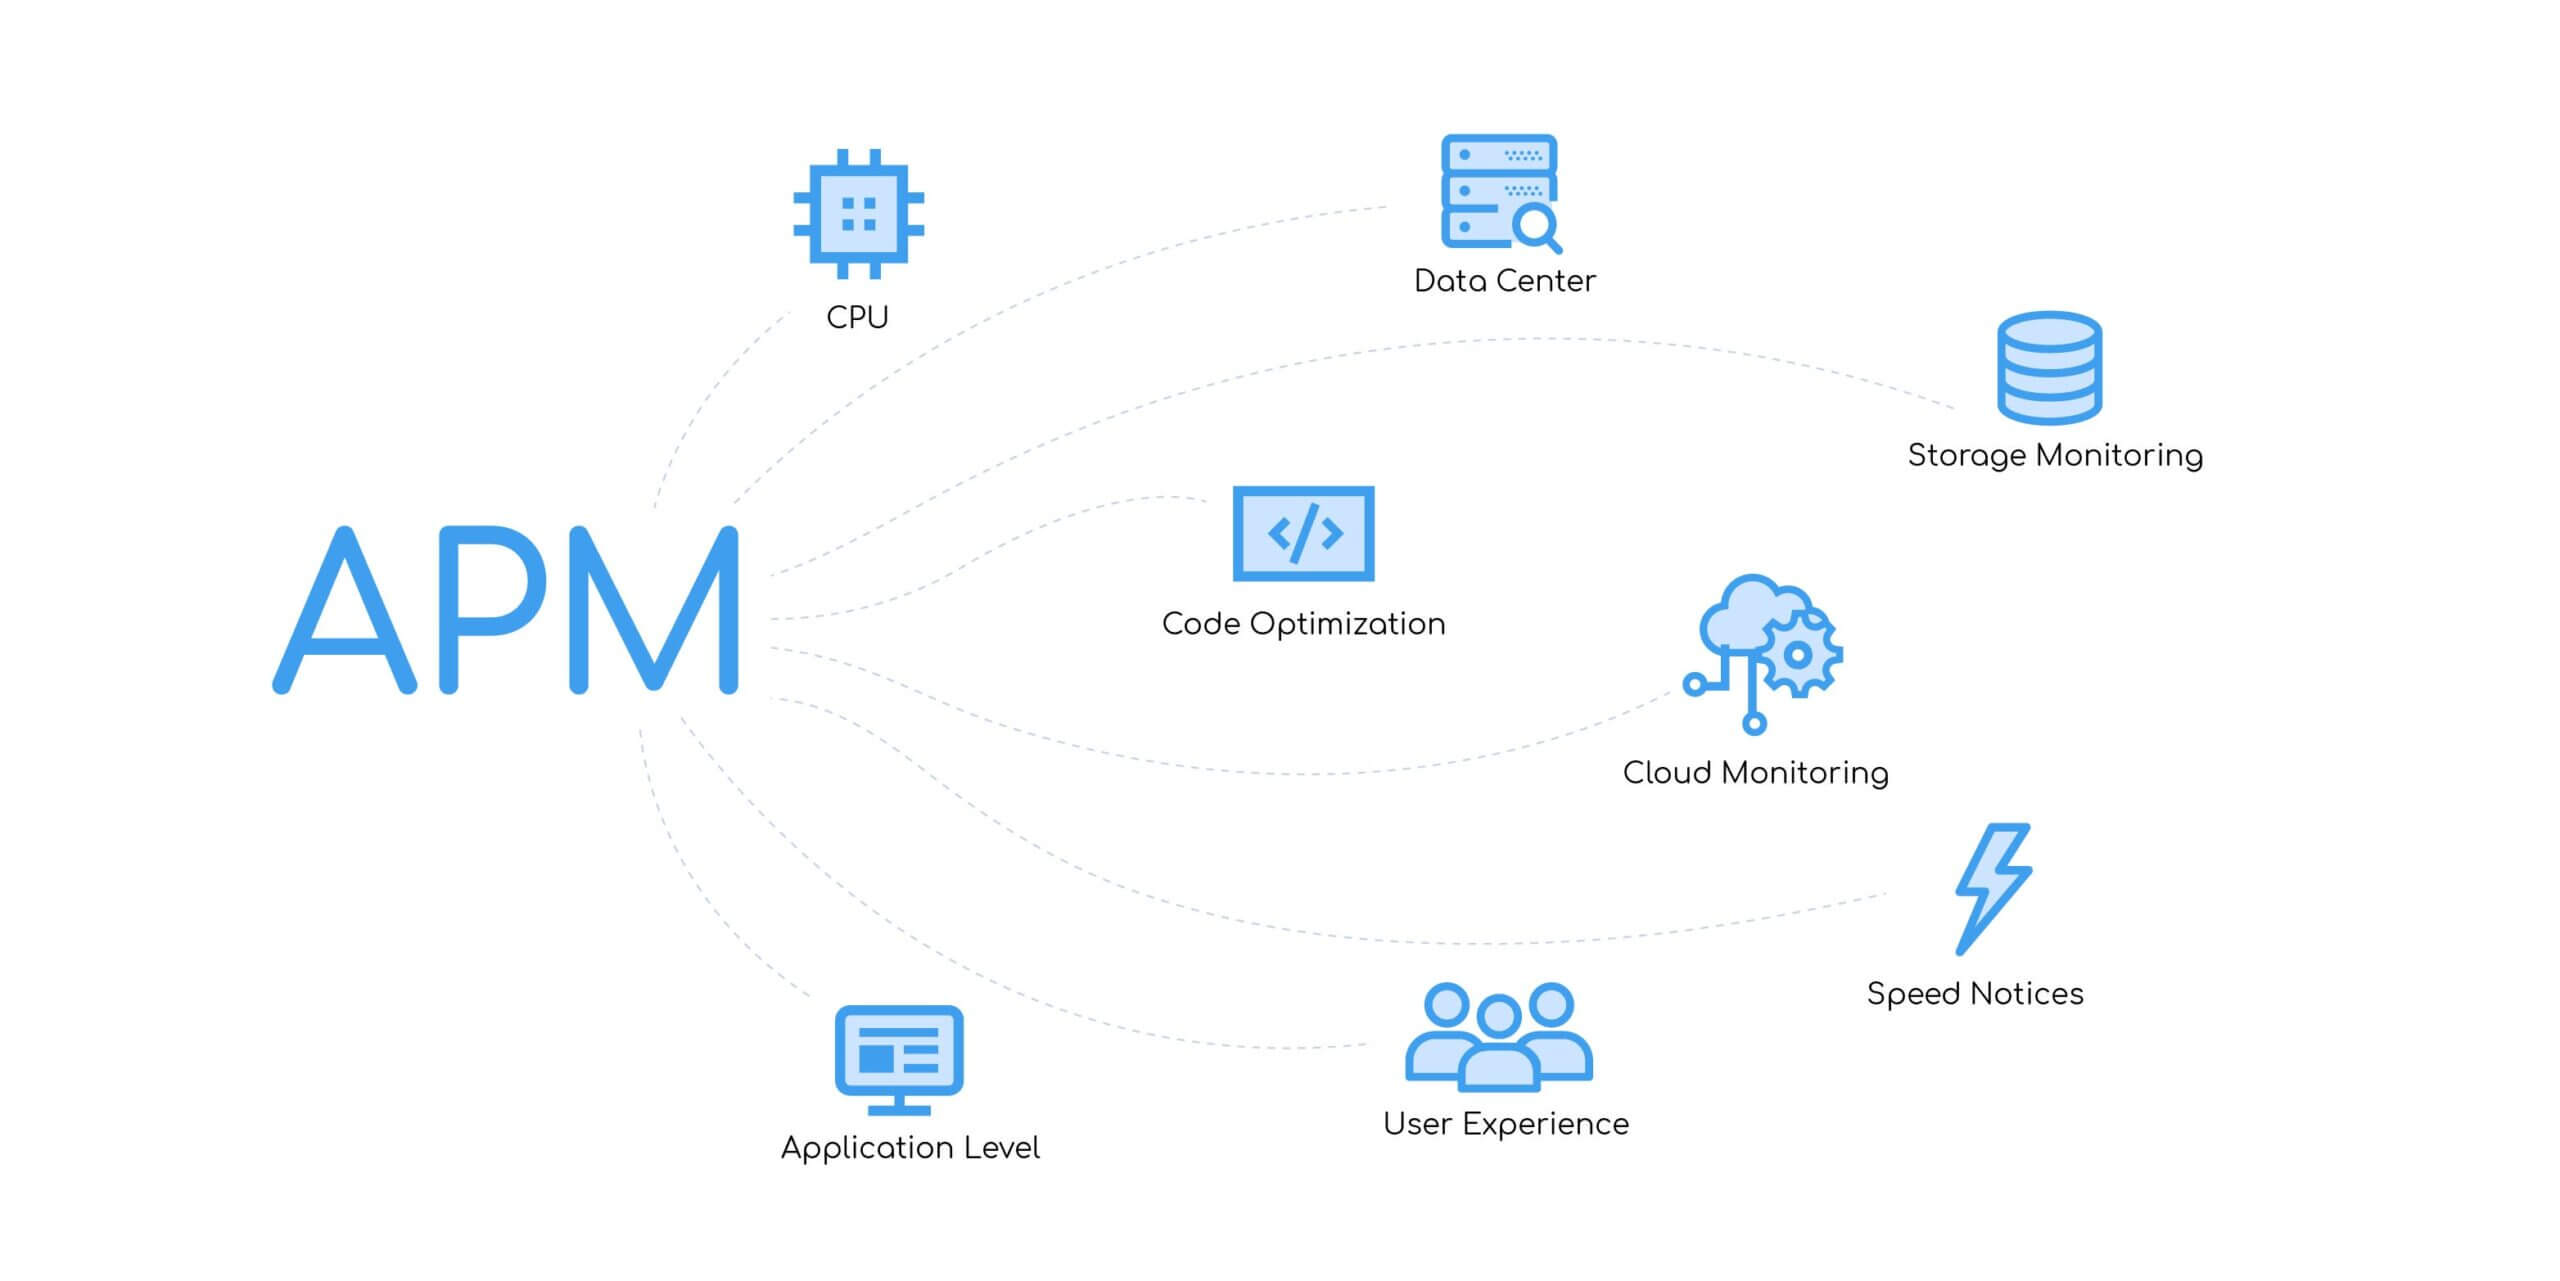
Le Monitoring de Performance des Applications (APM) est nécessaire et indispensable pour la maîtrise des performances des applications, disponibilité et qualité de service aux utilisateurs. Vos équipes internes spécialisées sont focalisées sur les applications critiques avec des APM complexes et doivent être prêtes à intervenir dès la dégradation des performances.
Le CIEP ATAKAMA avec son logiciel POWERHOUSE NUDGE APM vous propose de couvrir toutes les autres applications de votre parc en mode services managés avec un déploiement et une maintenance en condition opérationnelle (MCO) allant jusqu’au diagnostic de performance approfondi. Le CIEP ATAKAMA vous propose le déploiement, la MCO et le Diagnostic de Performances approfondi en mode services managés.
Avec un budget nettement moindre, par rapport à une approche totalement interne avec des APM listés au Gartner, vous aurez une solution au moins aussi efficace et, qui vous permettra de maîtriser les performances de vos applications en OPS et de rétablir une qualité de service corrompue très rapidement.

Audit et Diagnostic de Performance en Production IT
Confronté à des problèmes de performances des applications ou d’insatisfaction des utilisateurs, vous avez besoin d’un diagnostic rapide et qui couvre une vision de bout en bout incluant la vue depuis le poste utilisateur.
Notre équipe d’experts peut intervenir rapidement avec tous les logiciels de la suite POWERHOUSE NUDGE à leur disposition pour mener un audit de performance 360 et apporter les préconisations nécessaires destinées à vos différentes équipes (Développement, Poste utilisateur, Réseaux, Infrastructures, Architectures) avec toutes les informations utiles pour rétablir les performances et la qualité de service attendues.
Nos Experts Performances sont mobilisables très rapidement et en quelques jours, vous obtiendrez un rapport détaillé sur les analyses de problèmes de performances et les préconisations nécessaires pour optimiser les performances et rétablir la qualité de service dans les meilleurs délais. Plus de cellules de crise seulement des résultats rapides et pertinents.
A l’issue de l’Audit de Performances notre CIEP peut vous proposer le déploiement, l’administration et les diagnostics ponctuels d’une solution APM avec le monitoring disponibilité et expérience digitale utilisateurs pour une durée temporaire de 1 à 3 mois afin de vous assurer que vos engagements de qualité de services sont bien maîtrisés.
Suivi des performances
Assitance Technique Performance
Notre équipe d’assistance technique est constituée de Consultant ou d’Ingénieurs Tests de Charge ou APM, certifiés sur les outils du marché tels que NeoLoad, Loadrunner, Dynatrace, Appdynamics ou sur Jmeter.
Toutes nos ressources possèdent plusieurs années d’expérience dans les domaines des tests de charge ou du monitoring de performance application et la mise en œuvre ou l’exploitation de ces outils.
- Utilisation du POWERHOUSE NUDGE PERFORMER.
- Une assistance ponctuelle complémentaire.
TESTS & AUDIT DE PERFORMANCES
Tests de Performances Forfaitaires
Un projet de tests de performance ponctuel ou plusieurs projets en parallèle sur l’année avec des risques de pointe de charge.
ATAKAMA Tech Lab Ingénierie Performances vous apporte de la réactivité, la flexibilité pour aligner les ressources et les moyens techniques en fonction de vos besoins.
Nos propres logiciels et moyens techniques (Cloud infrastructures performances et logiciels POWERHOUSE NUDGE) et notre organisation flexible des projets se traduisent par notre modèle innovant « STOP and GO ».
EN MODE SERVICE MANAGÉS AVEC ENGAGEMENT DE SLA DE LA MCO
Monitoring Disponibilité et Expérience Digitale Utilisateurs
Le Monitoring Disponibilité et Expérience Digitale Utilisateur est très souvent difficile et chronophage à gérer par les équipes internes de la DSI. Et souvent, sources de tension entre la DSI et ses “Clients Internes”. Les problèmes recensés sont : des ressources non dédiées à 100%, le Turn Over, la réactivité et flexibilité face aux modifications ou évolutions des applications. Ces problèmes impactent fortement la maintenance en condition opérationnelle (MCO) donc le service rendu aux Métiers ou aux Directions Digitales.
Le CIEP ATAKAMA est organisé pour assurer le déploiement et la MCO du Monitoring Disponibilité et Qualité Expérience Digitale des Utilisateurs. Le CIEP ATAKAMA propose des engagements de SLA sur la MCO et les évolutions de la solution déployée. Vous n’avez plus les problèmes et vos “Clients Internes” reçoivent quotidiennement les rapports conçus spécifiquement pour répondre à leur besoin.
EN MODE SERVICE MANAGÉS AVEC ENGAGEMENT DE SLA DE LA MCO
Monitoring de Performance des Applications (APM )
Le Monitoring de Performance des Applications (APM) est nécessaire et indispensable pour la maîtrise des performances des applications, disponibilité et qualité de service aux utilisateurs. Vos équipes internes spécialisées sont focalisées sur les applications critiques avec des APM complexes et doivent être prêts à intervenir dès la dégradation des performances.
Le CIEP ATAKAMA avec son logiciel POWERHOUSE NUDGE APM vous propose de couvrir tout le reste votre parc applicatif en mode services managés avec un déploiement et une maintenance en condition opérationnelle allant jusqu’au diagnostic de performance approfondi. Le CIEP ATAKAMA vous propose déploiement, la MCO et le Diagnostic de Performances approfondi en mode services managés avec des engagements de SLA.
Avec un budget nettement moindre voire incomparable, qu’avec une approche totalement interne et des APM listés au Gartner, vous aurez une solution au moins aussi efficace et qui vous permettra de maîtriser les performances de vos applications en OPS et de rétablir une qualité de service corrompue très rapidement grâce à la réactivité et flexibilité de nos Experts et à notre engagement de SLA sur notre MCO et sur nos délais d’interventionP.
Audit et Diagnostic de Performance en Production IT
Confronté à des problèmes de performance des applications ou d’insatisfaction des utilisateurs, vous avez besoin d’un diagnostic rapide et qui couvre une vision de bout en bout incluant la vue depuis le poste utilisateur.
Notre équipe d’experts peut intervenir rapidement avec tous les logiciels de la suite POWERHOUSE NUDGE à leur disposition pour mener un audit de performance 360 et apporter les préconisations nécessaires destinées à vos différentes équipes (Développement, Poste utilisateur, Réseaux, Infrastructures, Architectures) avec toutes les informations utiles pour rétablir les performances attendues.
Nos Logiciels et Moyens Techniques
Satisfaction des Utilisateurs
Réactivité - Flexibilité - Efficacité
Tableau de bord et rapports en temps réel
Audit de Performance 360
Monitoring Proactif et Alerting
Analyser l'avenir
Satisfaction client / utilisateur: même à l’ère du Devops, les DSI sont à la peine
Pour les directions générales, la transformation numérique et la satisfaction client devient une priorité majeure de sortie de crise. Tandis que les DSI voient la satisfaction des utilisateurs comme un levier essentiel pour moderniser les processus internes.
Cette amélioration de l’expérience utilisateurs et clients internautes passent en particulier par la modernisation des pratiques (DevOps, CI/CD) au sein de la DSI. Mais cela n’est pas suffisant car, placer la satisfaction utilisateurs et clients internautes et l’Expérience Digitale au cœur des priorités de la DSI nécessitent de prendre en compte cette exigence du Dev à l’Ops.
Success Stories
Témoignage Clients
DietSensor choisit ATAKAMA Technologies pour réaliser des tests en charge de 50k utilisateurs pour une application mobile.
« Après avoir pris contact avec plusieurs acteurs du marché, notre choix s’est porté sur ATAKAMA Technologies qui fut le seul acteur à répondre sous 24 heures en mode forfaitaire et à s’engager sur les délais de réalisation avec une prestation clé en main. Son offre basée sur son Tech Lab Ingénierie Performances et sa suite logiciel POWERHOUSE Nudge en mode SaaS et son infrastructure Cloud nous ont convaincus. Nous avons décidé de réaliser des tests de montée en charge pour simuler 50k utilisateurs simultanés, en un temps très court de 5 minutes sur nos applications mobiles natives IOS et Android et un déploiement sur le Cloud Heroku de Salesforce. »
Success Stories
Témoignage Clients

DietSensor choisit ATAKAMA Technologies pour réaliser des tests en charge de 50k utilisateurs pour une application mobile.
« Après avoir pris contact avec plusieurs acteurs du marché, notre choix s’est porté sur ATAKAMA Technologies qui fut le seul acteur à répondre sous 24 heures en mode forfaitaire et à s’engager sur les délais de réalisation avec une prestation clé en main. Son offre basée sur son Tech Lab Ingénierie Performances et sa suite logiciel POWERHOUSE Nudge en mode SaaS et son infrastructure Cloud nous ont convaincus. Nous avons décidé de réaliser des tests de montée en charge pour simuler 50k utilisateurs simultanés, en un temps très court de 5 minutes sur nos applications mobiles natives IOS et Android et un déploiement sur le Cloud Heroku de Salesforce. »
Restez à jour grâce aux dernières actualités de votre secteur
Recevez par e-mail nos contenus 100% digitaux (Guides, Webinairs, Succès clients) ainsi que les dernières actualités!